Google Analytics for Beginners: the Ultimate Guide
Understanding and analyzing user behavior on your website is crucial for making data-driven business decisions. One of the most powerful tools available for this purpose is Google Analytics. Universal Analytics will stop processing data on July 1, 2023, so we want to ensure that you have the most up-to-date Google Analytics for beginners guide.
In this blog post, we will explore Google Analytics 4 (GA4) and unravel its key features, concepts, and essential reports, providing beginners with a solid foundation to effectively use this tool.
What is Google Analytics?
Google Analytics is a web analytics service offered by Google that allows website owners to track and analyze user interactions on their sites. It provides valuable insights into user behavior, demographics, traffic sources, and much more. Google Analytics helps businesses make data-driven decisions to improve their website’s performance, know your buyer persona and enhance user experiences.
What are the benefits of using Google Analytics?
All the following factors contribute to its great popularity and make it the most widely used digital analytics tool.
- It is a tool designed for anyone, without prior knowledge of analytics, to understand and use it.
- Google provides users with a large number of resources, tutorials, and helpful documentation.
- It is free, and all you need to use it is a Google account.
How to set up your first account
In just a few simple steps, you’ll be able to harness the power of data to gain valuable insights about your website. Let’s get started:
- Create an account: Begin by creating your Google Analytics account. This will provide you with a unique tracking ID and access to all the features and tools offered by Google Analytics.
- Obtain a tracking tag: Once you have your account, you’ll need to obtain a tracking tag. This tag is a small snippet of code that needs to be placed on every page of your website that you want to track.
- Implement the tracking tag: Take the tracking tag and embed it into the HTML code of your website pages. This will enable Google Analytics to collect data about the visitors and their interactions on your site.
- Start collecting data: Once the tracking tag is implemented, Google Analytics will start gathering valuable data about your website’s performance. You’ll be able to track metrics such as visitor demographics, pageviews, bounce rates, and much more.
- Report and analyze: With data flowing into your Google Analytics account, it’s time to explore the powerful reporting and analysis capabilities. Gain insights into your audience, identify trends, track conversion rates, and make data-driven decisions to optimize your website’s performance.
By following these steps, you’ll unlock a wealth of information about your website, enabling you to make informed decisions and improve your online presence. Now let’s dive in and harness the full potential of Google Analytics!
Difference between Universal Analytics and Google Analytics 4
Universal Analytics and Google Analytics 4 (GA4) are two versions of Google’s web analytics platform, each with its own unique features and approach to tracking and analyzing user behavior. Here are some key differences between the two:
1. Data Model:
🟧Universal Analytics: Universal Analytics uses a session-based data model, where data is organized around sessions and pageviews. It relies on cookies to track users across sessions and devices.
🟩Google Analytics 4: GA4 uses an event-based data model. It focuses on tracking individual user interactions or events on a website or app. The event-based approach provides more flexibility and granularity in understanding user behavior throughout the entire customer journey.
2. Tracking and Measurement:
🟧Universal Analytics: In Universal Analytics, tracking is primarily based on pageviews and events. It requires manual implementation of tracking code and additional customization for advanced features.
🟩Google Analytics 4: GA4 simplifies tracking by automatically collecting certain events and parameters without the need for manual code implementation. It provides enhanced tracking capabilities for web and app properties, making it easier to measure user interactions and conversions.
3. User-centric Approach:
🟧Universal Analytics: Universal Analytics tracks users using a combination of cookies and anonymous identifiers. It does not provide a complete view of user behavior across devices unless specific configurations, such as User ID tracking, are implemented.
🟩Google Analytics 4: GA4 introduces more advanced user tracking options. It supports the use of User ID, allowing you to track and analyze user behavior across multiple devices and platforms, providing a more comprehensive understanding of the user journey.
4. Reports and Insights:
🟧Universal Analytics: Universal Analytics offers a wide range of predefined reports, including audience, acquisition, behavior, and conversion reports. It provides in-depth insights into website performance, traffic sources, and user behavior.
🟩Google Analytics 4: GA4 introduces a simplified and streamlined reporting interface. It provides a set of essential reports focused on key metrics and user behavior, such as engagement, user demographics, and conversion tracking. GA4 also offers enhanced reporting for e-commerce businesses.
5. Machine Learning and AI:
🟧Universal Analytics: Universal Analytics does not have native machine learning capabilities.
🟩Google Analytics 4: GA4 incorporates machine learning and AI to provide more advanced insights and predictive analytics. It includes features like automated insights, predictive metrics, and anomaly detection, enabling businesses to identify trends and patterns in user behavior more effectively.
How Google Analytics 4 collect data
Let’s take a closer look at how data is collected:
- Page Loading: When a visitor loads a page on your website, the data collection process begins. Every interaction, click, and event is captured to provide valuable insights into user behavior.
- Tracking Code: The heart of data collection lies in the tracking code. Also referred to as a tracking tag, analytics pixel, or simply a tag, this small snippet of JavaScript code is inserted into the HTML of every page on your website. It acts as a bridge between your website and Google Analytics, capturing important information.
- Data Gathering: As visitors navigate through your website, the tracking code collects various events and browser data. It tracks pageviews, clicks, form submissions, transactions, and much more. This data is the foundation for generating meaningful reports and uncovering valuable patterns and trends.
- Data Transmission: Once the data is collected, it is securely transmitted over the internet to Google Analytics. This ensures that your data remains safe and confidential while being ready for analysis.
- Storage and Reporting: Google Analytics stores the collected data and utilizes powerful algorithms to generate insightful reports. These reports provide valuable metrics and visualizations, enabling you to understand your audience, measure website performance, and make data-driven decisions.
Basic concepts for Google Analytics 4 beginners
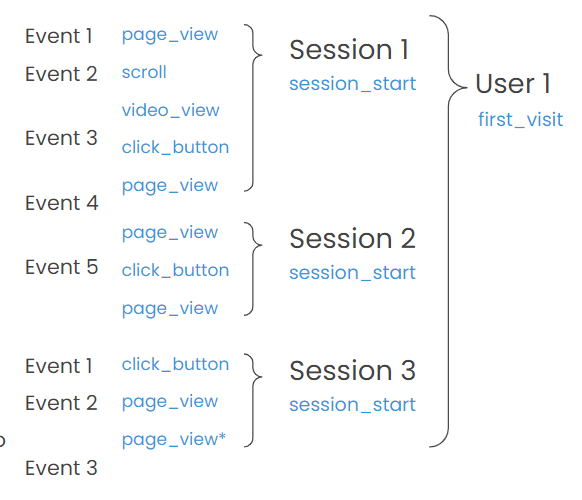
➡️Events
Events are the actions that take place on our website. These events can be attributed to different users and grouped into specific time periods or sessions.
- Automatically tracked events: Basic interactions of any website or app (first_visit, first_open, session_start).
- Enhanced measurement events: User interactions with content (click, file_download, scroll, video_start) need to be enabled.
- Custom events: Almost anything you want to measure on your website, app, or digital resource.
➡️User identification:
- User Id: It is your unique customer identifier that you can share with GA4 so that it can identify the user across devices (e.g., log in).
- Google Signal: Google’s system that allows generating a user profile by combining browsing data collected by different cookies on various Google sites.
- Device ID: It is a cookie that Analytics inserts in the browser to be able to identify it.
Here, an example of navigation on a streaming platform:
- A new user visits the homepage.
- They scroll through the page.
- They watch a promotional video.
- They click on the “Save Now” button. They visit the pricing plans page.
- The next day, they visit the pricing page. They click on the “Continue” button.
- They visit the subscription form page.
- 40 minutes later, they click on the “Continue” button.
- They visit the payment summary page. 15 minutes later, they see the payment completed page.
Essential reports for Google Analytics 4 beginners
The next step is to learn how Google Analytics 4 reports are organized. You can use them to understand the customer journey and provide data for it.
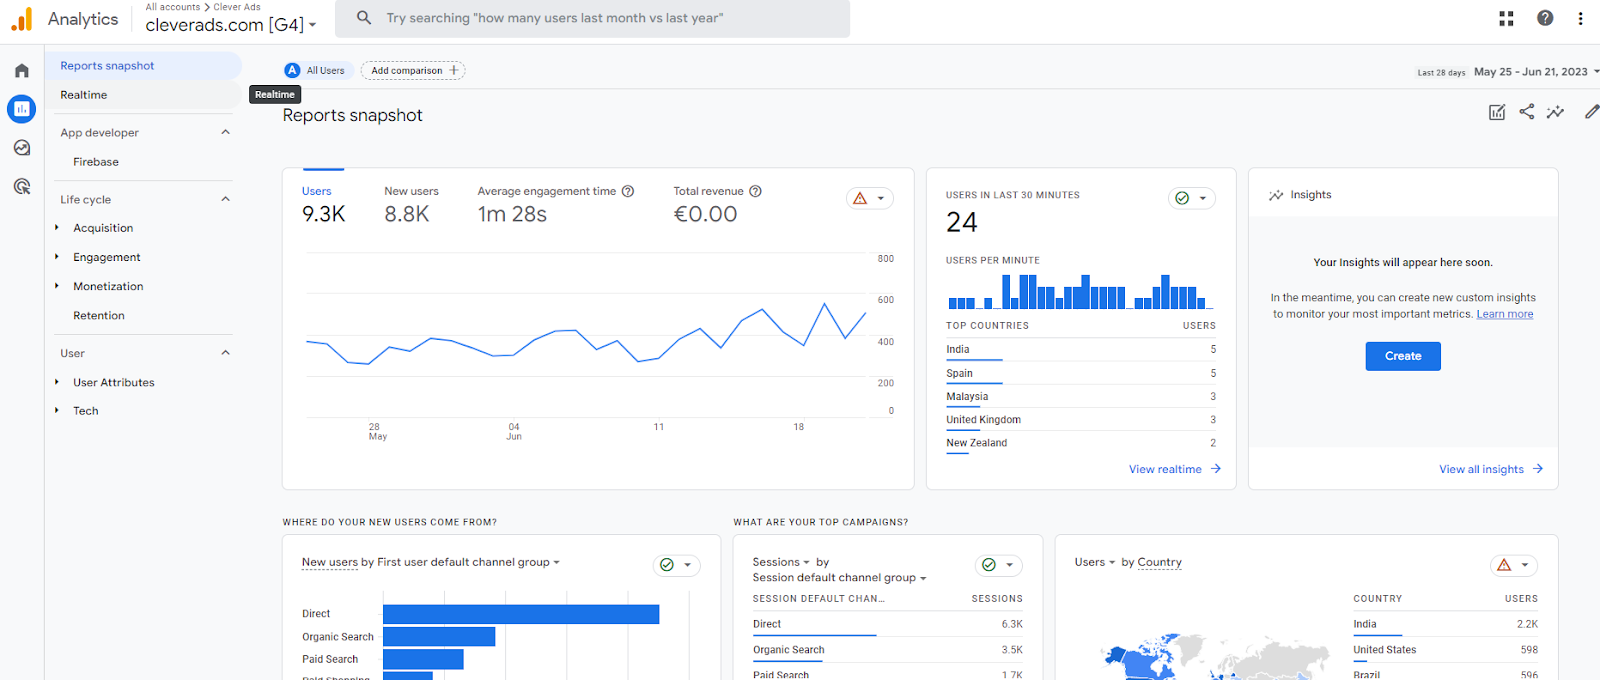
➡️Reports snapshot
- Realtime: The real-time report updates in real-time, providing a snapshot of the most recent user interactions, their geographic locations, the pages they are currently viewing, the events they are triggering, and the traffic sources they are coming from.. This feature is particularly useful for monitoring the immediate impact of marketing campaigns, tracking live events, or observing user behavior in real-time.
➡️Lifecycle
- Acquisition: How do users reach my website? Which marketing actions and campaigns have successfully brought traffic to my website?
- Engagement: How do they interact with the pages and content?
- Monetization: What benefits do those actions bring me?
- Retention: What is the level of user loyalty?
➡️User
- User attributes & Tech: What are those users like?
Customize your reports going to “Explore” tab
In the Exploration interface, you’ll see various customization options. Here’s how you can use them:
- Start a new exploration or your a template
- Add Metrics: Click on the “Add Metrics” button to select the metrics you want to include in your report. Metrics are the quantitative data points you want to measure, such as page views, conversions, or revenue.
- Add Dimensions: Click on the “Add Dimensions” button to choose the dimensions you want to analyze. Dimensions are the qualitative attributes you want to segment your data by, such as traffic source, device category, or geographic location.
- Apply Filters: You can apply filters to narrow down the data displayed in your report. Click on the “Add Filter” button and define the filter conditions based on your requirements. For example, you can filter by specific traffic sources or include/exclude certain pages.
- Use Exploration Tools: Google Analytics 4 provides various exploration tools to further customize your report. These tools include pivots, breakdowns, segments, and comparisons. Experiment with these options to gain deeper insights into your data.
- Save and Share: Once you’ve customized your report to your satisfaction, you can save it for future use. Click on the “Save” button to give your report a name and save it in your Google Analytics account. You can also share the report with other users if needed.
Remember, the Exploration feature in Google Analytics 4 offers a flexible and interactive interface for analyzing your data. Take time to explore its various options and create insightful and customized reports. For example, you can create a SEO or Social Media Report and share them with your marketing team.

Google Analytics 4 for dummies, 5 final tips
✅Set up goals: Define specific goals for your website, such as newsletter sign-ups or purchases, and track their performance using GA4.
✅Use custom dimensions: Implement custom dimensions to capture additional data relevant to your business, such as user roles or product categories.
✅Leverage audience segmentation: Segment your audience based on demographics, behaviors, or interests to personalize marketing campaigns and content.
✅Utilize data filters: Apply filters to exclude internal traffic or specific IP addresses, ensuring accurate data analysis.
✅Stay up-to-date: Google Analytics is continuously evolving, so make sure to stay informed about new features and updates to maximize its potential.
Clever Ads Manager: An easier alternative to Google Analytics 4
As well as tracking organic website traffic, you should also monitor your advertising campaigns and optimize them. With our comprehensive suite of features, including real-time tracking, customizable dashboards, and advanced reporting, you’ll have all the tools you need to optimize your online presence.
✅Clever Ads Manager: All your advertising campaigns in one app.
✅Gain deeper insights into your ads performance, update budget, understand user behavior, activate or pause your campaigns, and make data-driven decisions to fuel your business growth
✅Over 100,000 downloads on Android & iOS.
✅Rated 4.6 out of 5 by users.

