
Universal Analytics Guide: Track your metrics in Universal Analytics
If you own a website, you have probably already implemented Google Analytics on it. This is one of the first things a web owner needs to do. However, having implemented it is not the same as knowing how to use it. If you’re among those who are unfamiliar with the platform, here is a Universal Google Analytics for beginners guide to familiarize yourself with this must-have digital tool.
Note: this post refers to Google Universal Analytics. Click here if you want to learn about the new version of Analytics, known as Google Analytics 4.
[ez:toc]
What is Google Analytics?
Google Analytics is a tracking tool that can provide you with a lot of valuable information about your website, such as your customer profile, your web quality and the performance of your marketing campaigns.
How does Google Analytics work?
When you install Google Analytics on your website, a few lines of code are included on every page of your site. This is the renowned Google Analytics tracking code, also known as Google Analytics’ Tag or Google Analytics’ Pixel.
This tracking code is activated during page load and begins to collect information about activity on your website. The data comes from the page itself but also from the browser used to display it. Google Analytics collects, analyzes and compiles this information and shows it to you in different reports to help you make informed decisions about your digital marketing strategies.
What information will you find on Google Analytics?
The information collected by Google Analytics is presented in standard reports and you will find these reports organized in different sections: realtime, audience, acquisition, behavior and conversions.
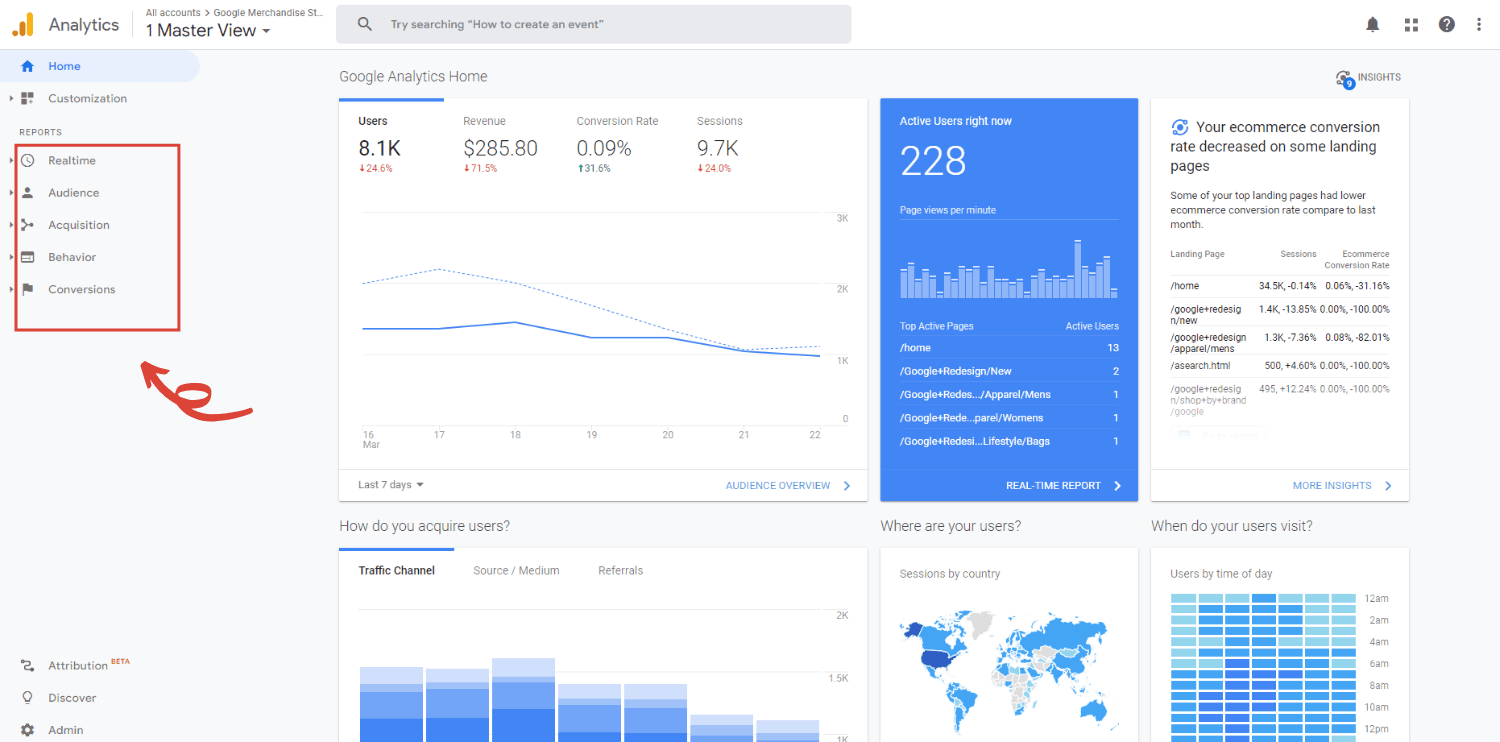
- Realtime: As you’ve probably already guessed, Realtime will show you the live traffic that your site is receiving minute by minute. If your site is lacking traffic, take a look at our Google Ads creator, the easiest way to increase traffic for beginners.
- Audience: In this section you will find all the information about your users profile. Audience reports will help you understand your visitors by providing you with information such as the countries from which they come from, what languages they prefer, and what technologies or devices they are using for browsing.
- Acquisition: Acquisition reports will give you information about how users have reached your site. In this section you will find out where users were browsing before reaching your site, and the marketing channels that drove them to your pages. A very valuable piece of information to measure the impact of your marketing campaigns.
- Behavior: Behavior reports will show you how users interact with your site. This will measure things like how much time they spend on your site, what content they are looking for, and which pages they like the most and which they like the least. These key metrics will help you assess your audience engagement and the quality of your website.
- Conversions: For this portion, you will receive metrics to assess how profitable your user interactions are. You can set your business goals and even assign a conversion value to monitorize your site’s performance and return on investment.
Basic concepts for Google Analytics beginners
Before introducing you to the reports, it’s worth clarifying some basic concepts that may not be as clear:
What is a user?
Many people think that a user is a person who simply visits your site. But this is not entirely correct, there is a small nuance that may surprise you.
In actuality, a user is not a person, but a browser. You remember that every time a page loads, the tracking code gets information from the browser used to view the page? The data provided by the browser is anonymous information, not matched to any real person. But it allows you to figure out what the person behind the browser is like.
Keep in mind that if someone visits your site using different browsers with different devices (Chrome, Explorer, Mozilla, Safari, Yahoo…), Google Analytics will not be able to identify them as the same person and will consider them as different users.
What is a session?
Sessions are essentially the visits that your site receives. A session starts when a user navigates to a page that includes the Google Analytics tracking code, and then compiles all the information about the user’s activity.
Just like life in the real world, some sessions can be quite short and others can last longer. Sometimes you receive old friends (returning users) and other times a new neighbor (new user) can visit you. The visit can begin and end at your front door (your home page) or it can take place in different rooms (pages) of your house.
In the same way that guests can visit your house more than once, a user can visit your site several times and have several sessions associated. Therefore, on a healthy website the number of sessions should be greater than the number of users.
What is a pageview?
Every time a user loads (or reloads) a page on your website, the tracking code creates a pageview. Pageviews are the total number of pages viewed in the tracking period.
A user usually loads multiple pages during each session. In fact, we can say that the more pageviews, the more interesting your content is for the visitor. Therefore, the number of pageviews should be greater than the number of sessions. With the exception of some sites designed to drive traffic to other websites.
What is an event?
As you’ve read, data collection is mainly tied to page load. Additionally, Google Analytics gives you the opportunity to measure some user’s interactions independently from a page load thanks to events. Downloads, link clicks, form submissions, and video views are examples of actions that you can track as events.
Due to its complex nature, event configuration is beyond the knowledge of Google Analytics beginners. You may require help from your website developer to utilize it. If you’re feeling brave, you can try doing it yourself by following these Google guidelines to event measurement.
Essential reports for Google Analytics beginners
You might be overwhelmed by all this information concerning Google Analytics and aren’t exactly sure where to start. Do not despair, these are the most relevant standard reports to grow your business:
- Audience Reports
- New vs Returning Users Reports
- Devices Report
- Traffic Sources Report
- Site Content Report
- Goals Overview Report
Let’s go deeper into each report to know what kind of information they can provide you:
1. Audience Reports
Google Analytics is an essential analytical tool but it also has its limitations. Knowing these limitations will help you understand the real meaning of your reports and metrics to get the right insights to improve your website.
Some limitations are related to the fact that the tracking code doesn’t collect personal data but anonymous data from the browsers, this can mainly affect the audience reports.
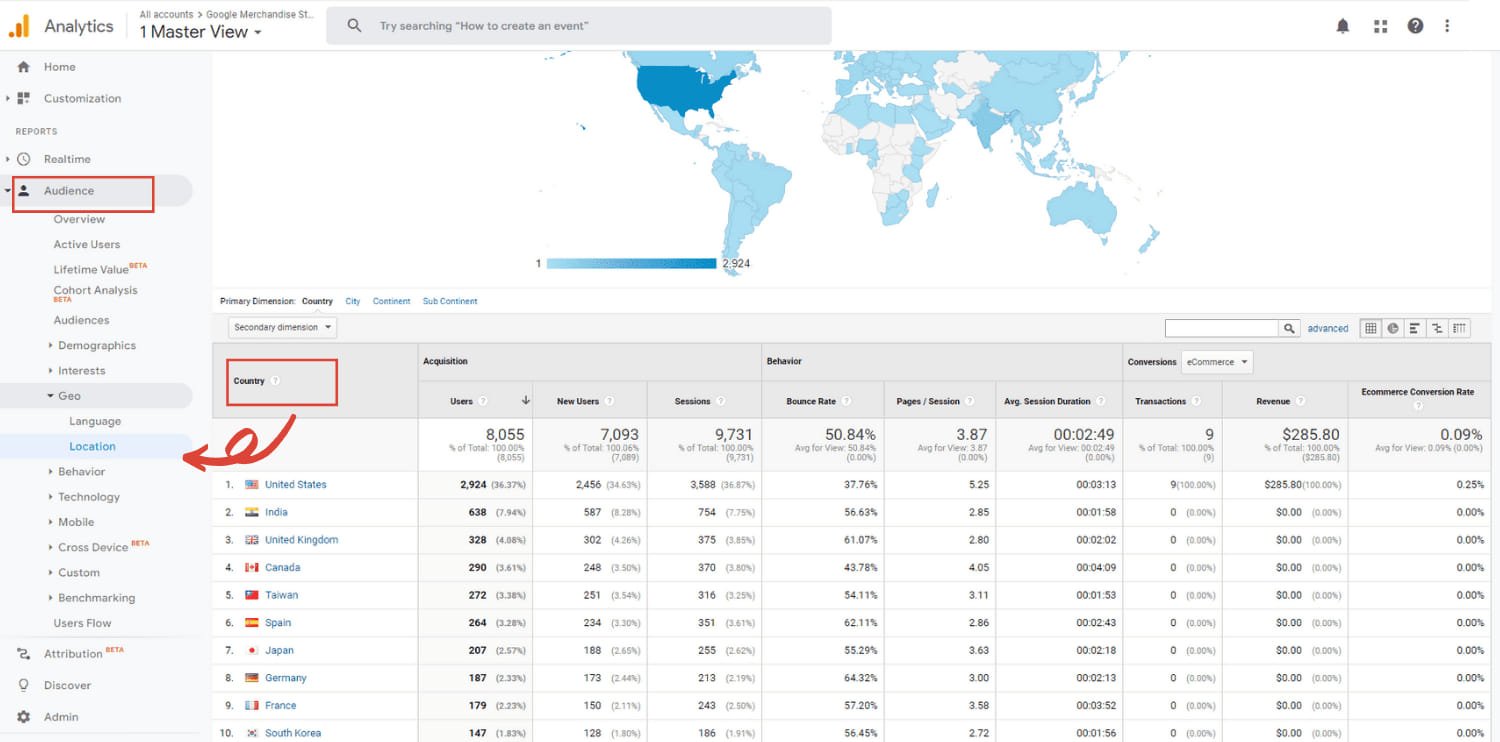
Geo Report
Go to Audience > Geo, this report can be very useful not only for geolocating your audience, but also to discover new market opportunities. To master it you need to remember that the data comes from the browsers, not people. The language shown on the report is the language the browser is set to, and location comes from the ip address, which can be approximated. Read more about Geographical data from Google.
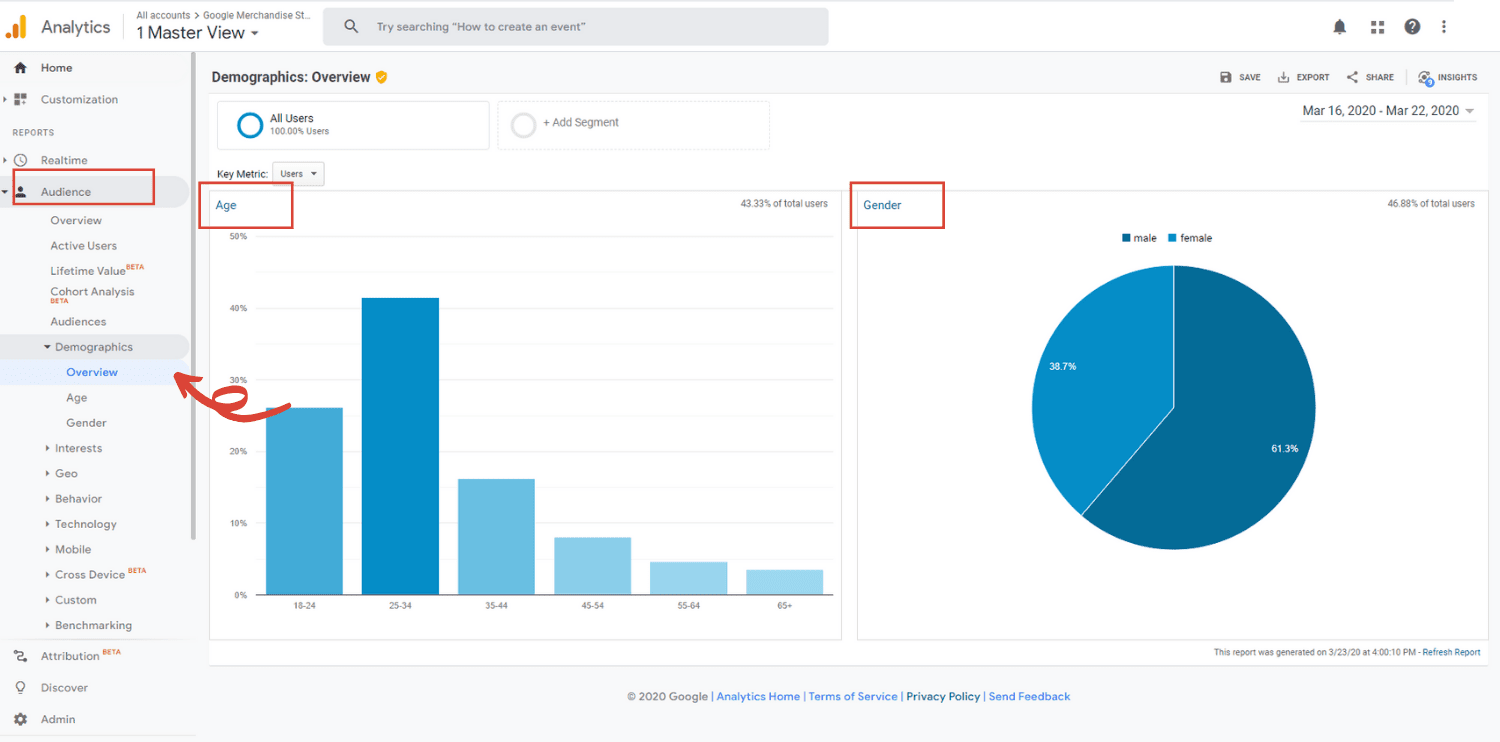
Audience Demographics & Interest Report
Demographics and interest data provides information about the age and gender of your audience, along with the interests they express through their online travel and purchasing activities. Find the reports on Audience > Demographics and Audience > Interest.
But the tracking code doesn’t have access to people’s personal information? How is it possible to get that data? Quite simply, it isn’t possible. Google Analytics just deduces the information from the browser activity. Take a look at your profile on Google and see if it fits you.
Google Analytics uses cookies to identify browsers. To understand how cookies work, continue reading on.
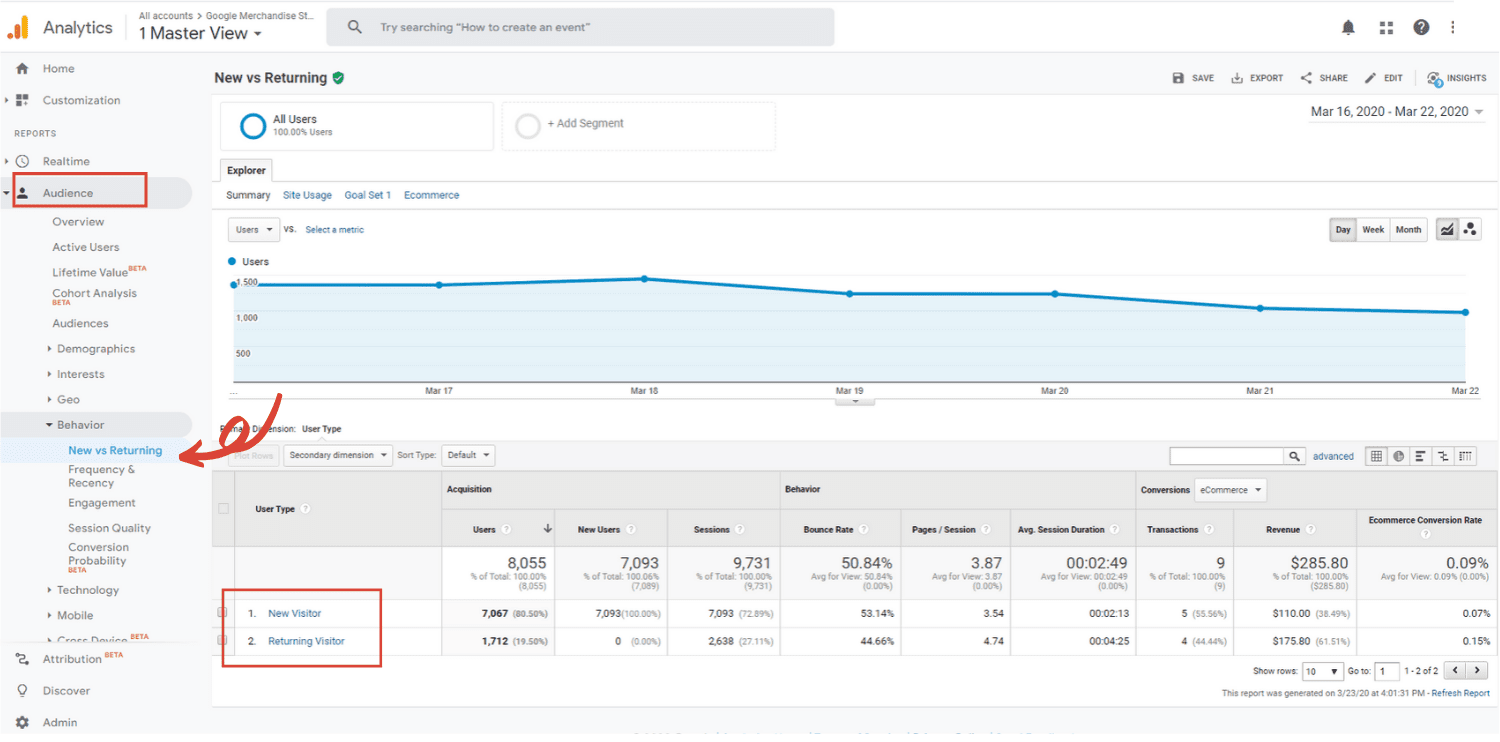
2. New vs Returning Users Reports
Getting a user to come to your site for the first time is a great feeling. Getting them to visit again is even better. After all, it’s the returning visitors who usually end up becoming readers, followers and customers. Go to Audience > Behavior > New vs Returning to know what percentage of your users are coming back to your site.
But here comes the tricky part! Because the data is collected anonymously, how does the pixel know which user the data belongs to? Google Analytics identifies users with cookies to solve this. In essence, a cookie is a small text file stored on the visitor’s browser. Each cookie is unique and works as a user ID. This makes it possible to identify the user each time it returns to your site.
You can imagine a cookie as some kind of hand stamp for nightclubs and events. When a page loads, the tracking code searches on the browser’s information looking for a previous “stamp” or cookie from a previous visit to your nightclub. If it finds it, then it’s known to be a returning user. If it doesn’t, a “stamp” is given to the user by including a cookie on the browser’s code.
A browser can accumulate many different cookies from many different sites. But cookies can be removed from the browser, as a stamp can be removed by washing your hands. This means that the next time the user visits your website, Analytics won’t find the old cookie and will consider it as a new user assigning it a new ID and losing the possibility to match the previous data with the following one.
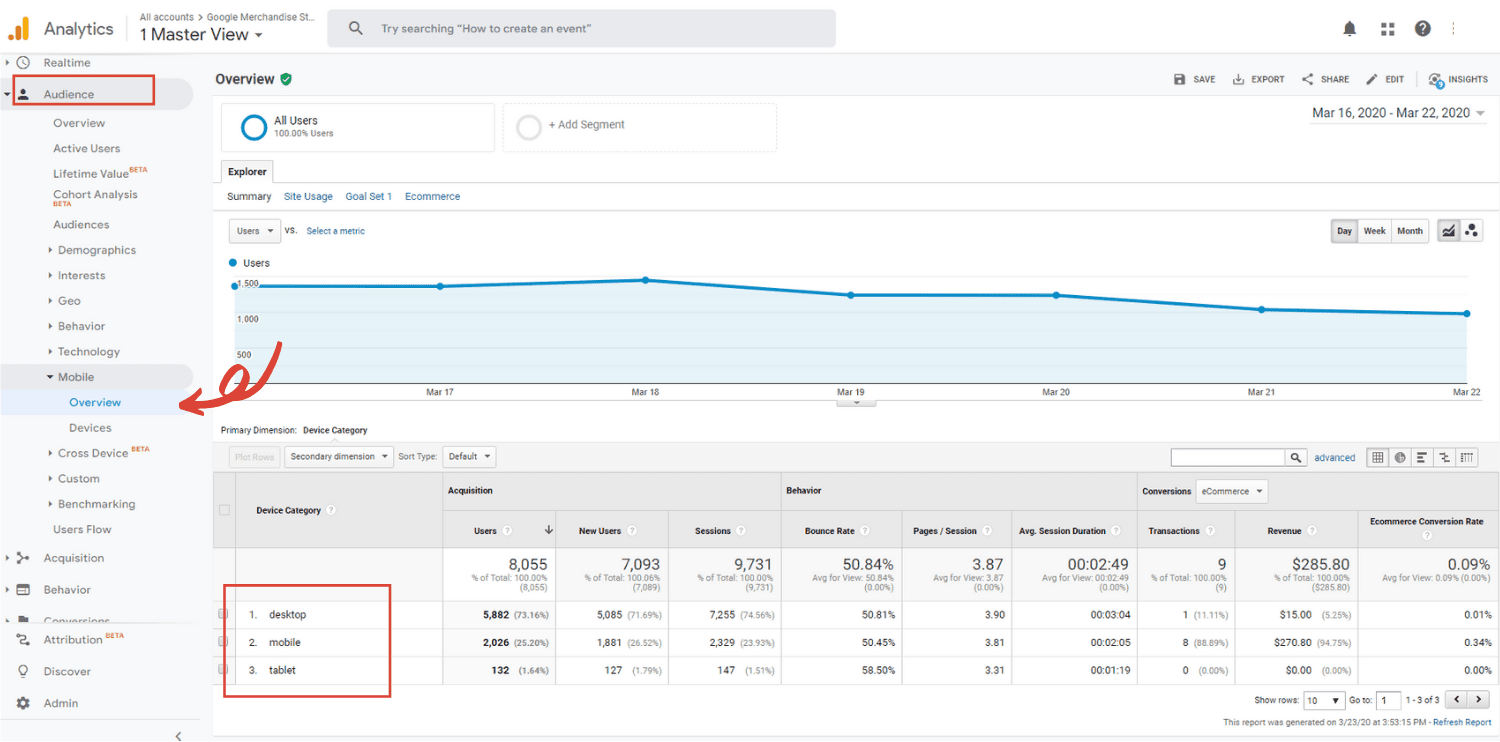
3. Devices Report
This report will give you information on the devices people use to access your site; mobile, tablets or laptops. Go to Audience > Mobile > Overview to find out how your site performs on each device. Before making a strategy decision, such as not displaying your ads on some devices, be aware that some devices may help others. For example, it is known that people use mobile phones to search and read, but they generally prefer a laptop to buy because it usually offers a better user experience during a purchase. Google’s mobile first indexing has become a reality so make sure your site is properly adapted.
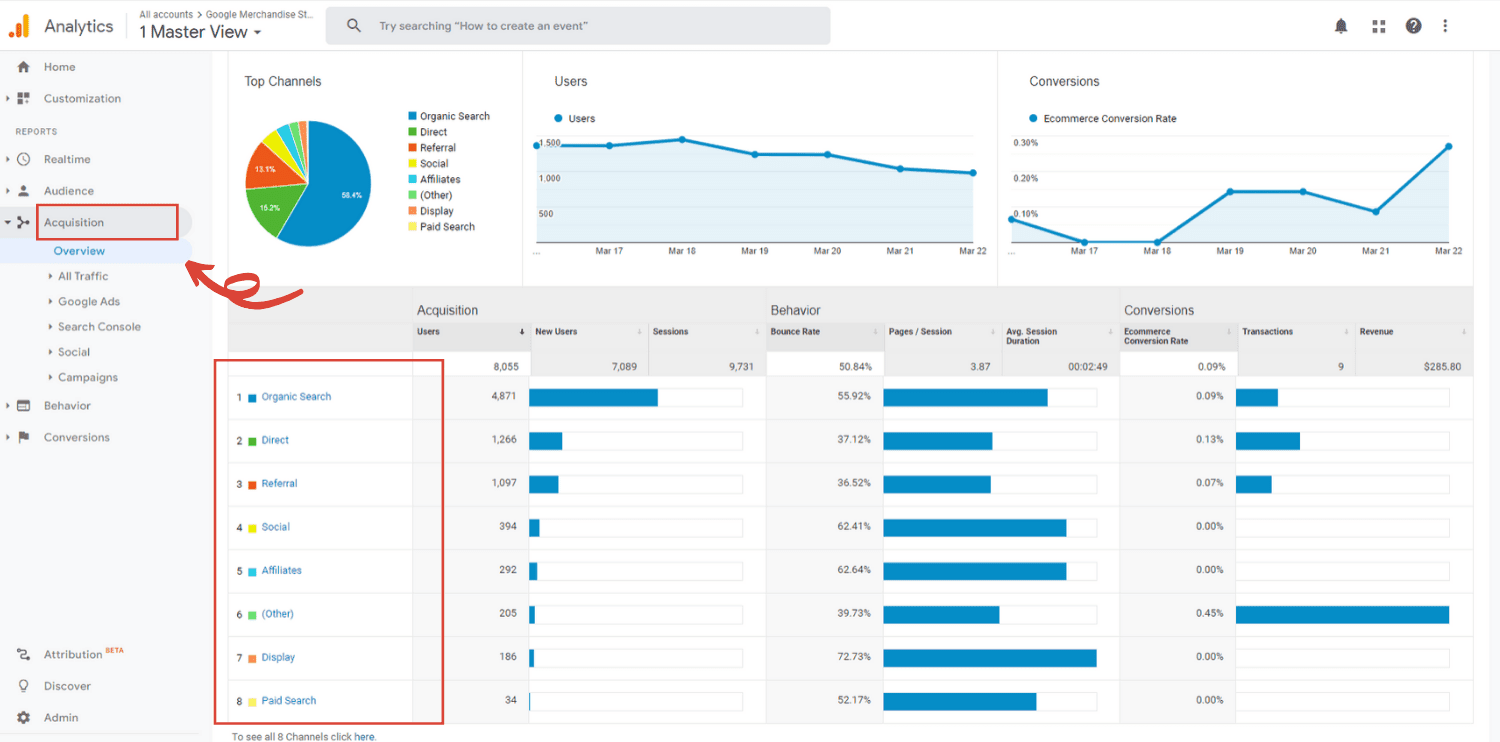
4. Traffic Sources Report
As I said before, acquisition reports will give you information about how users have reached your site. Through it, you will find what acquisition channels are bringing visitors to your web and where users were browsing before reaching your site. You will also be able to compare the performance of different marketing channels and discover which sources send you the highest quality traffic and conversions.
If you are a digital marketer this is your must-have report. Go to Acquisition > Overview to get a quick breakdown of your traffic sources. By default, you will find your traffic grouped into different channels.
Default channel grouping:
- Direct: on this channel you will see the visits that arrived on your site either by typing your website URL into a browser or through browser bookmarks.
- Organic search: This contains the users who come from organic results in different search engines.
- Paid Search:This channel groups users that come from paid results on different search engines.
- Display: on this channel you will see the visits that came to your site by clicking on a banner displayed online.
- Referral: groups visits that are forwarded from a different website than yours.
- Affiliates: on this channel you will see the traffic referred from your affiliates.
- Social: this channel groups users who were in any social network before reaching your site.
- Email: you will see the visits that come from emails.
- Other: if Google Analytics cannot determine where the user is coming from, it will add it to this channel.
Below the Overview tab you will find other tabs dedicated to specific acquisition channels. Depending on your marketing strategy, some tabs may be of more interest than others. For instance, if you are focused on your social media strategy you will find useful information on the Social tab (Acquisition > Social). If you are working on link building, partnerships and affiliate, check the Referral report (Acquisition > All Traffic > Referral).
You can also track your online advertising campaigns (Acquisition > Google Ads). Make sure to link your Google Ads account to give Google Analytics access to all the information about your campaigns. If you need help with your Google Ads strategy take a look at our Google Ads tools and discover how to advertise on Google effortlessly.
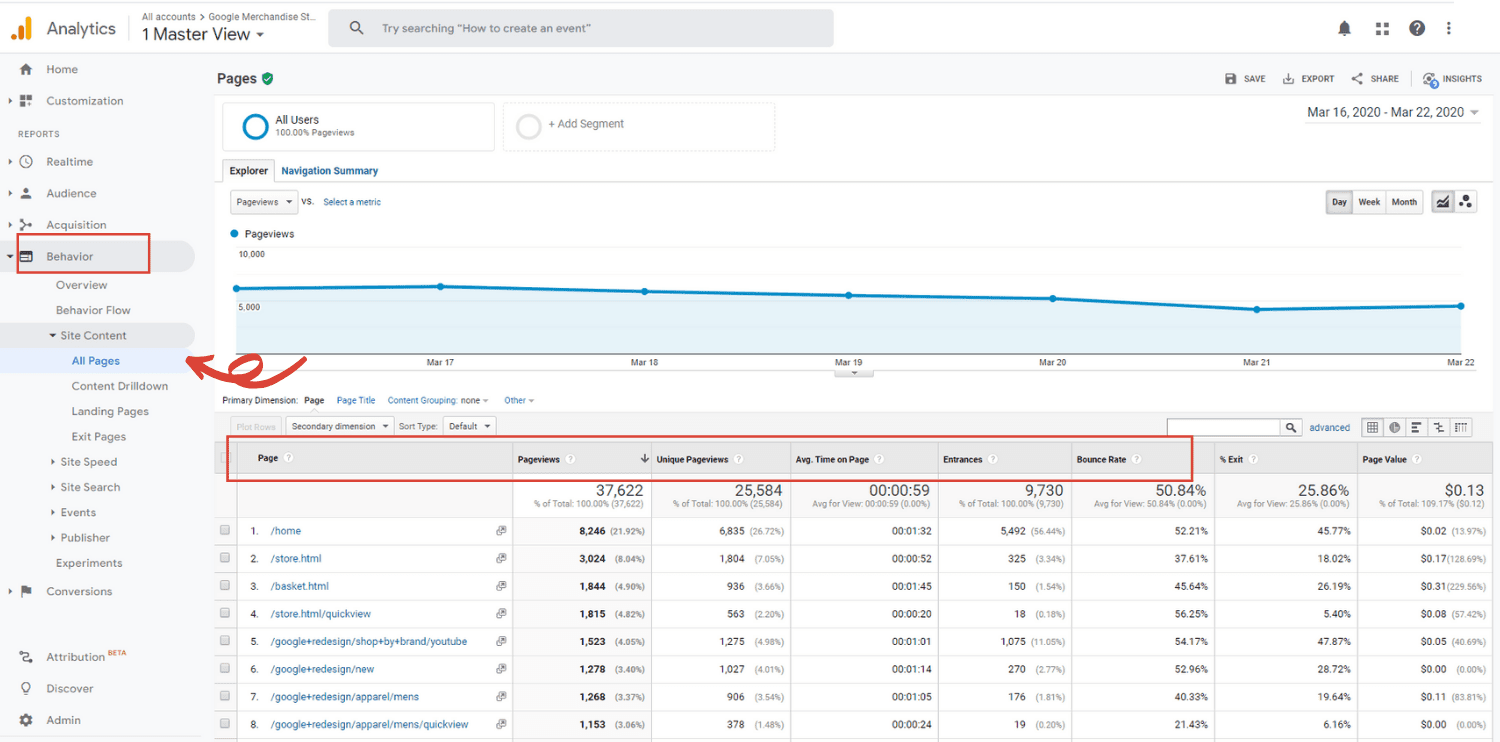
5. Site Content Report
This report is very useful for understanding how your different content types or pages perform. Check Behavior > Site Content > All pages. You will find all the pages shorted by their page URI (the part of the URL after the domain name). The home page usually appears as a simple slash.
Checking the pageviews on this report you will see which pages are receiving more visitors. Other metrics like average time on page and bounce rate indicates how engaged users are with your pages. Usually, the bounce rate is inversely proportional to the average session duration. This means that as the bounce rate increases, the average session duration decreases. Site engagement can be considered an indicator of your website’s success. The more time the user spends on your site the better.
But there is one limitation that turns this report into a tricky one. This limitation is that Google Analytics can’t track page closings. Therefore, it cannot know exactly when a user leaves your page. How does it calculate how much time users spend on your website? The answer is easy, it can’t do it accurately.
Avg Session Duration & Bounce Rate
The session timer starts the moment the page is loaded. With every new page loading, the tracking code records a timestamp and adds time to the session. Google Analytics takes the last timestamp as the end of the session, making it so your average session duration is probably underestimated.
A bounce is when a user starts and ends the session on the same page. A high bounce rate usually indicates that the content is not relevant or engaging. But it also depends on the objective of your website. Notice again that some landing pages are designed to drive traffic to other websites. In that case, a high bounce rate means that the page is serving its purpose.
What happens with session duration if a user only visits one page? Because there is no second time-stamp, a bounce is assigned a session duration of 0 minutes and 0 seconds. As if the user had never visited the page in the first place. This skews your average session duration lower than it should be.
Most of the time this can be solved with an event. Events implemented on a page also generate a timestamp. This way, when the user clicks on a link, submits a form or views a video within the page a new timestamp is generated. This adjusts the time spent on the page and avoids bouncing. Make sure you have implemented the necessary events to track the actual duration of the session, before you begin to consider engagement metrics. Remember that event tracking requires additional implementation and you will probably need help from your website developer.
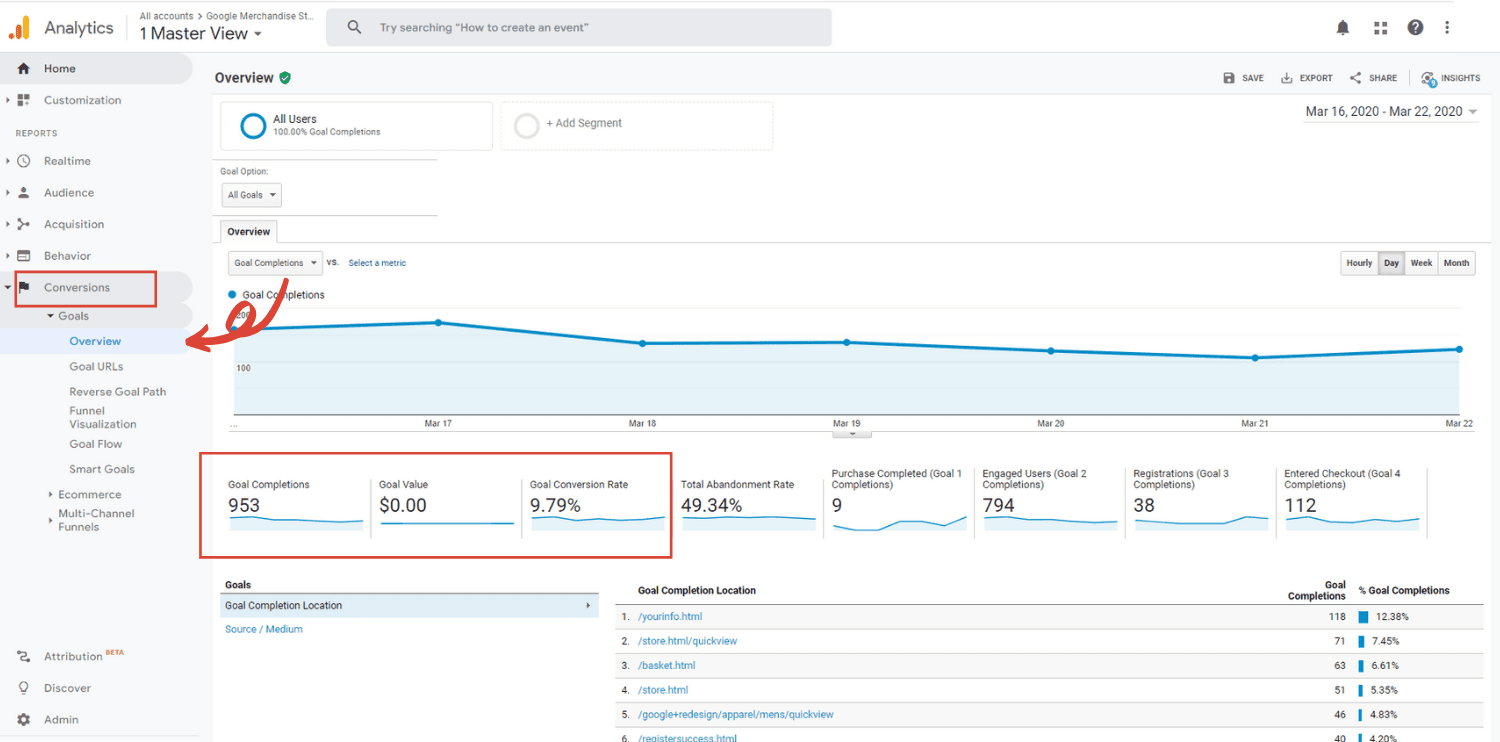
6. Goals Overview Report
Go to Conversions > Goals > Overview to track your site’s performance in terms of conversions. The number of conversions & conversion rate are the essential metrics that you will find here. This is probably the most important report for any business manager, but it may be also one of the most complex. Not because of the metrics themselves, but because of the difficulty in the configuration.
Goal measurement is a mix of business strategy and technical implementation. Follow these steps to succeed:
- Set your business goals. Common goals include: phone calls, captured leads, purchases, content downloads and anything else a part of the overall business objective. You can track a maximum of 20 different goals on your site.
- Decide what you need to track based on your business goals. You must find what specific user action will indicate that the goal has been reached.
- Implement the necessary events in the right places on your page to track those actions (button, link, form). As mentioned previously, you may need help from your website developer.
- Configure Google Analytics to recognize those events as your conversions.
- Set an economic value for your conversions.
There are some goals that can be based on pageviews and may not need event implementation, for example a purchase. Most eCommerce has a thank you page and the user reaches that page only when the purchase is complete. You can configure Google Analytics to track a thank you page view as a conversion.
For further information on how to set your first goal check Google’s instructions.
How to link it to your advertising platforms?
Connecting your advertising platforms to Universal Analytics will allow you to gain additional insight on what your visitors and audience do on your website after clicking on your ad. Having your ads metrics in universal analytics will help you understand if your landing pages are performing well or are confusing to the user, or if your audience is getting stuck somewhere.
In the end, combining your ad data with other metrics can help you optimize your advertising strategy and improve your performance. Also, if you’re using our Clever Ads Manager mobile app you’ll be able to gather deeper advertising insights when connecting analytics, and have all your advertising platforms data properly tracked there.
Let’s learn how to track your ad metrics in the main advertising platforms.
Track Google Ads metrics in Universal Analytics
The first step is linking your Google Ads account to Universal Analytics. To do that you can:
Go to Analytics > Select “Admin” > find Google Ads Linking under “Property”
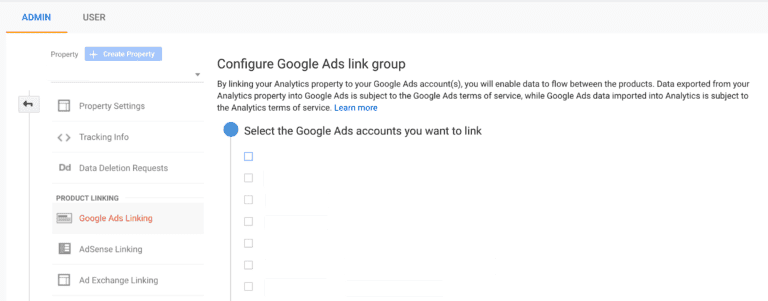
Then you’ll just need to click on the Google Ads accounts you want to link and then click “Continue”.
It’s important that you have auto-tagging enabled in Google Ads so data is properly reported between platforms. Take into consideration that there are some data discrepancies between platforms. For instance, Google Ads reports each visit as a click and Analytics reports a session as a visit, so you can find the same action represented as two clicks for Google Ads and one session for Universal Analytics.
Once Google Ads is linked to Universal Analytics you’ll be able to see your Google Ads data inside the platform, such as your campaigns, keywords, search queries, shopping data or display targeting.
Track Facebook Ads metrics in Universal Analytics
Facebook has its own Facebook Ads Manager, however it can be limited if you want to track the full user journey or your user behaviour once they get to your site.
Normally, you’ll see all traffic coming to your site from Facebook under the referrer facebook.com, including not only your Facebook ads traffic but also traffic coming from your posts. If you want to track exactly which traffic comes from your Facebook ad campaigns, ad sets, and ads you’ll need to use UTM parameters in the URLs you include in your Facebook ads.
You can do so directly from the Facebook ads manager, when creating your ads. Under the URL parameters section, you can select “Build a URL Parameter”. We recommend you to set it the following way:
- Campaign source – Facebook
- Medium – PPC
- Campaign name – the name of the Facebook ads campaign
You can also add custom parameters to include the Ad Set name and the Ad Name, but it depends on the granularity you want to reach when tracking your campaigns.
Then, on Google Analytics, you just need to analyze your Facebook Ads performance by going to:
Acquisition tab > All Traffic > Source/Medium > Select Campaign in the secondary dropdown
There you’ll be able to see your Facebook ads campaigns performance. If you want to check it at an ad set or ad level, just add custom dimensions from the admin panel on the property settings.
Track Microsoft Ads metrics in Universal Analytics
To properly see Microsoft Ads (formerly Bing Ads) campaign metrics on Universal Analytics, you also need to set up UTMs, same as on Facebook. However, there’s an automatic way to do it through enabling the automatic markup the following way:
Accounts & billing > Account tab > Add UTM tags to my landing page URLs
Then, if you already had added manual tags to your campaigns you can select “keep my existing tags” or “replace all existing tabs” with automatically generated ones if you hadn’t created UTM tags yet.
Track Twitter Ads metrics in Universal Analytics
For tracking Twitter Ads traffic in your Universal Analytics account you can use UTMs in the links you use in your ads, the same as we explained for the other advertising platforms. Remember you can always use Google’s UTM builder for creating your URLs with parameters.
Google Analytics for dummies, 10 final tips
To put the cherry on top of this post, here’s a brief list of 10 Google Analytics tips for dummies that you may find useful:
No page load, no data
The tracking code is activated during the page load and only then does it start collecting information about the activity on your website.
A user is not a real person
Always remember that the information you see is based on anonymous data extracted from a browser, and not from real people.
Cookies come and go
Be aware that people can easily delete analysis cookies from their browsers to eliminate other storage on their devices. This prevents new sessions data from being matched to previous sessions data.
Medical check
On a healthy website the number of pageviews should be greater than the number of sessions, and the number of sessions greater than the number of users.
Misleading metrics
Implement events to track actual session length and avoid fake bounces before you begin to consider engagement metrics.
Your rules, your goals
You decide what the objectives of your page are and what economic value they have.
Remember the funnel
To navigate reports, remember that the main sections work like a sales funnel: Acquisition, Behavior, and Conversion.
Search and find
If you can’t find the report you’re looking for, use the search tool on the top of the page.
Logbook
Record the actions that may impact your metrics by adding notes to graphs. You can do this with ease by clicking the arrow at the bottom of the line graphs.
Double check the dates
If you see strange trends on the graphs or can’t find data that’s supposed to be there, check the date range!
Conclusion
I hope this Google Analytics for beginners guide has helped you in your first steps with digital analysis. To delve into the handling of this complex tool, I recommend you to explore the Google Analytics Academy.
If you haven’t implemented Google Analytics on your website yet, check this link to learn how to set up the Google Analytics tag. Do notice that you may need help from your website developer to insert the tracking code into your website pages.

